
If you are tired of constantly explaining to the board or to clients where the differences in reports come from, make yourself comfortable. After reading this text, you will stop treating these discrepancies as a failure and start reading them as two precise, complementary lenses in the same camera.
Table of contentsExpand
If every time I hear the question in a conference room or during an audit: “Radek, why does Google Ads show 50 conversions, while I see only 30 in GA4?”, a zloty landed in my pocket, the budgets for my advertising activities could be twice as high.
This is one of the most frustrating phenomena in digital marketing. You spend real money, open two panels created by the same technology company, and right from the start you are greeted by two completely different sets of numbers. The first instinctive reaction of most marketers, analysts, and e-commerce managers is to look for an error in the code: “GTM is probably firing the tags incorrectly”, “The transactions must have been duplicated”, “GA4 is losing traffic”.
I have news for you that, on the one hand, will take a considerable weight off your shoulders, and on the other, will change the way you look at analytics: in 90% of cases, this discrepancy is not a technical error. It is a deliberate, engineering-driven consequence of how both systems were built.
Introduction – Why trying to “make the data match to zero” is a dead end
Monday, 9:00 a.m. You open three different dashboards to prepare your weekly performance summary:
- Google Ads reports success: 150 conversions (Conversions).
- Google Analytics 4 cools the enthusiasm: 95 key events (Key Events) attributed to paid search.
- CRM / E-commerce system unemotionally records the facts: 110 paid orders.
For clarity: in Google Ads we say conversions (Conversions), in GA4 key events (Key Events)
The classic corporate saga begins. The Performance Manager claims that GA4 “doesn’t count traffic.” The analyst claims that Google Ads “takes free credit for itself.” Trust in analytics drops to zero, and the Management Board asks one simple but paralyzing question during the meeting: “So how much did we actually earn from these ads?”
The first impulse of most marketing teams is always the same: to reach a situation in which GA4 and Google Ads show exactly the same number. You spend weeks auditing tags in Google Tag Manager, checking triggers, standardizing conversion windows, and modifying tracking codes.
The result? The numbers still differ, and your time and budget have been wasted.
This is not a bug. It is a feature of the system.
The pursuit of zero discrepancy between GA4 and Google Ads is based on the false assumption that both tools are two different scales measuring the same object. They are not two scales. They are two completely different measuring instruments, designed to answer different business questions:
- Google Ads is investment accounting (Paid Silo): It asks “How efficiently is the advertising budget I am responsible for working?”. Its task is to demonstrate and value every single touchpoint within the paid Google ecosystem in order to feed Smart Bidding algorithms and win the next auction.
- GA4 is user journey cartography (Marketing Mix): It asks “How do different channels on the site influence one another on the way to the final action?”. Its goal is to assess the entire ecosystem – from organic searches, through social media and emails, to direct visits.
You are demanding that two tools with absolutely contradictory data architectures agree on a single result. It is like comparing the number of empty bottles after a party with the number of receipts from the liquor store. Both concern the same evening, but the fact that the receipt shows 5 beers while there are 12 bottles in the living room does not mean that the math is broken.
Instead of wasting time on an impossible data correction, you need to accept the structural nature of this difference.
Debunking myths – Before you start looking for errors, let’s clean up the concepts
Before I move on to breaking down the counting mechanisms themselves, I need to deal firmly with two myths. They are repeated by agencies, pseudo-experts in SEO-driven articles, and sometimes even by analysts themselves during status meetings. Eliminating these two fundamental conceptual errors will save you months of looking for failures where the system architecture is simply working as designed.
Myth 1: “In GA4, every report uses a different attribution model”
This is an absolute classic and the reason why every other post in analytics discussion groups sounds like a cry of despair. I very often hear the following words spoken with great seriousness: “The User acquisition report works on First Click, Traffic acquisition on Last Click, and key event reports on DDA”.
This is a common myth resulting from equating dimension scope (Scope) with an attribution model (Attribution Model). Freely mixing these two concepts turns analytics into chaos.
Here is how it actually works, which I will show using specific dimensions in the interface:
- User scope (User-scope): The User acquisition report does not use any conversion attribution model at all. It operates on the First user source / medium (First user source/medium) dimension. The system assigns this source once – at the moment when a given user appears in your property for the first time ever. It remains unchanged regardless of how many transactions that user makes in the following months.
- Session scope (Session-scope): The Traffic acquisition report attributes traffic based on the Session source / medium (Session source/medium) dimension. Here, attribution takes place at the beginning of each specific session and, in standard reports, is based on Last Non-Direct Click logic (the last direct source is ignored if a paid or organic source occurred earlier). This is also not an attribution model for key events.
- Event scope (Event-scope): Only when we move to key events (Key Events) do attribution models come into play (with Data-Driven Attribution as the default). You will find them in the Advertising / Attribution section or by building your own Explorations. They divide credit for a specific key event among the touchpoints on the path.
My conclusion: Stop comparing the “First user source = Google Ads” column with the conversion report in Google Ads and claiming that “the attribution doesn’t match.” You are measuring two completely different dimensions of spacetime.
Myth 2: “GA4 does not automatically filter bots, while Google Ads removes spider traffic”
The second myth I regularly encounter turns reality upside down. I often hear the theory that GA4 “swallows like a pelican” all artificial traffic, bots, and spammers, while Google Ads keeps watch and filters invalid clicks, which is why GA4 contains “more junk.”
Let me explain what it looks like under the hood of both systems:
- GA4 has built-in and fully enforced filtering of known bot traffic. The system does this automatically based on the official, constantly updated IAB/ABC International Spam and Bots List. What is more – unlike the old Universal Analytics, in GA4 this mechanism cannot even be turned off in the property settings. GA4 filters out known machine traffic at the data collection stage (ingestion phase).
- Google Ads filters clicks, not analytics events. The Google Ads system is designed to protect your budget against so-called Invalid Clicks (invalid clicks, e.g. repeated clicks on your ad by competitors or click-farm bots). The Google Ads system will deduct these clicks from billing and exclude them from the advertising panel. However, if a bot somehow passes the safeguards and triggers the script on the site after the code loads (and is not on the IAB list), GA4 will record the session, while Google Ads will exclude the paid click.
The difference is that Google Ads protects your wallet from advertising budget fraud, while GA4 protects the cleanliness of the database from spam contamination. Explaining discrepancies in key events by saying “because GA4 counts bots” is proof of unfamiliarity with the IAB specification.
Fractional conversions (DDA) – Why 0.4 in Google Ads is NOT the same as 0.4 in GA4
One of the most deceptive phenomena I encounter during audits is the illusion created by fractional values.
You enter the Google Ads panel and see that a given campaign generated 1.35 conversions (Conversions). You open GA4, go into attribution reports, and see values such as 0.40 or 0.85. At that moment, a light goes on in the head of most marketers: “Aha! Since I have fractions from the Data-Driven Attribution (DDA) model here and there, it means both systems use the same math, and GA4 is simply losing something!”.
This is a fundamental conceptual error. I will show you, using a specific purchase path example, that 0.40 conversions in Google Ads describes a completely different dimension of reality than 0.40 key events in GA4. It should be remembered that although Google Ads also uses a data-driven attribution (DDA) algorithm by default, it applies it only within paths containing paid Google touchpoints, while GA4 examines the full marketing mix.
The Google Ads advertising silo (Mono-channel DDA)
The Data-Driven algorithm in Google Ads works extremely efficiently, but it has one key limitation: it is completely blind to anything that happens outside the Google advertising ecosystem. It sees only your paid links in search, Performance Max campaigns, YouTube ads, or display network banners.
Imagine the following user path:
- The user clicks a search ad (Google Search Ads).
- After 3 days, they click a shopping ad (Google PMax).
- After another 2 days, they click a remarketing banner (Google Display Network).
- They make a purchase worth PLN 1000.
What does Google Ads do with this?
It sees 3 of its own touchpoints and 1 completed purchase. The Data-Driven model in your Ads account algorithmically analyzes the weight of each of these clicks and distributes this one full conversion only among these three campaigns.
- Search Ads gets, for example,
0.20conversions. - PMax gets, for example,
0.50conversions. - Display Network gets, for example,
0.30conversions.
The sum of fractions in your Google Ads account is exactly 1.00. Google Ads took the entire success pie and divided it among its own advertising formats.
The holistic mix in GA4 (Cross-channel DDA)
Now let’s see what the actual, complete path of the same user, recorded by GA4, looked like:
- The user clicks a search ad (Google Search Ads).
- A day later, they arrive from unpaid search results (Organic Search).
- A day later, they click a Facebook ad (Meta Ads).
- They open a promotional newsletter (Email Marketing).
- They click a remarketing banner (Google Display Network).
- They make a purchase.
What does GA4 do with this?
The Data-Driven model in GA4 sees all 5 touchpoints representing your entire marketing mix. Its task is to value the contribution of each of these channels in bringing the customer to the transaction.
GA4 divides this one full key event as follows:
- Organic Search:
0.10 - Meta Ads:
0.40 - Email:
0.20 - Google Search Ads:
0.15 - Google Display Network:
0.15
You break down the report in GA4 by paid traffic from Google and see that the sum of fractions attributed to your Google Ads campaigns in this case is only 0.30 (0.15 + 0.15).
In this scenario, Google Ads will show 1.00 conversion attributed to Google, while GA4 will show 0.30 – this is where the typical 2-3x difference in favor of Ads comes from on long multi-channel paths.
Direct comparison: Two different fractions
To ensure you never fall into this conceptual trap again, I have compared both mechanisms in a clear table:
| Feature | Fractional DDA in Google Ads | Fractional DDA in GA4 |
| Field of view (Scope) | Mono-channel: Sees only paid Google traffic (Search, PMax, YouTube, Display). | Cross-channel: Sees the entire mix (Organic, Meta Ads, Email, Direct, Ceneo, Google Ads). |
| The concept of the “whole” (1.00) | The whole pie (1.00) is assigned always to paid Google campaigns, provided that a purchase occurred after a click. | The whole pie (1.00) is divided among all channels on the path. Google Ads gets only its share. |
| Business goal | Optimization of Smart Bidding algorithms (setting bids and ad value in the auction). | Assessment of the profitability of the entire media mix and allocation of budgets between channels. |
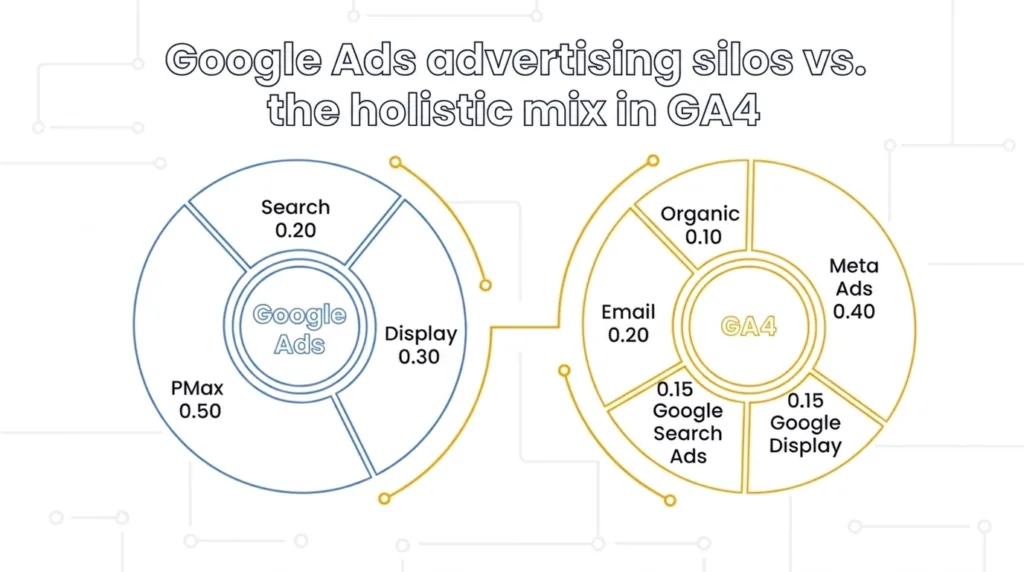
My summary of this section is simple: A fraction in Google Ads is a fraction of a pie reserved 100% for Google. A fraction in GA4 is a fraction of your business’s entire marketing pie. Once you understand this difference, you will stop expecting the sum of fractions in both panels to ever match.
The five pillars of structural discrepancy – Anatomy of the gap
Now that I have cleared the ground of attribution myths and explained the specifics of fractional DDA conversions, I will move to the very core of the problem. I will show and explain five independent engineering mechanisms that physically prevent data between GA4 and Google Ads from aligning.
Each of these pillars has a fixed, predictable direction of impact. Differences in reports are therefore not chaotic noise – they result directly from the adopted definitions.
Pillar 1: Event dating (Click-date vs Event-date) and Processing Lag
This is the least understood and most frequently overlooked difference by marketing teams. Both systems record the same business fact, but they place it in completely different time drawers.
- Google Ads uses Click-date attribution: It attributes the conversion to the date of the ad click.
- GA4 uses Event-date attribution: It attributes the key event to the date on which it actually occurred on the website.
Let’s trace a real-life e-commerce case:
- February 28 (Friday evening): The customer clicks your ad in Google Search.
- March 5 (the following week): After considering the purchase, the customer returns directly to the site and buys equipment for PLN 2000.
What will you see in the reports when you analyze the results on March 10?
- Google Ads will add +1 conversion to the report for February (because the click occurred on February 28). February results in Google Ads will be updated retroactively (attribution lag).
- GA4 will add +1 key event to the report for March (because the transaction physically passed through the payment gateway on March 5).
In addition, this difference is compounded by the phenomenon of Processing Lag on the GA4 side. While Google Ads can update click and simple conversion data within a few hours, full processing of key events, recalculation of the Data-Driven model, and the application of any privacy thresholds in GA4 usually take from 24 to 48 hours (on small accounts or after major configuration changes, this delay can be even longer). Crucially: in “real-time” reports (Real-time), data in GA4 is always incomplete. If you pull reports “from yesterday,” GA4 processing lag artificially increases the gap.
Pillar 2: Event counting rules (Counting Rules)
Another mechanism that you configure under the hood of both systems, and one that is rarely visible at first glance in ready-made reports.
Google Ads allows you to define the counting method at the conversion action level:
- One (One per click): Counts only one conversion after a click. Useful in lead gen (one form = one lead).
- Every (Every): Counts all transactions completed within the conversion window after a single click. The standard in e-commerce.
GA4, on the other hand, records key events (Key Events) individually – each event call (e.g. purchase) is a separate point in the database (unless the counting rule for a given metric has been changed in the configuration to Once per session).
Where does the mismatch arise?
Imagine a B2B customer who clicks an ad and then places 3 separate wholesale orders within 30 days.
- If the conversion action in Google Ads is set to One, Google Ads will show 1 conversion, while GA4 will record 3 key events.
- If, in an e-commerce store, the customer refreshes the thank-you page (thank-you page) after purchase, a properly configured Google Ads tag with a unique transaction ID will block the duplicate, while an incorrectly implemented GA4 event may count the repeated call.
Pillar 3: Unit of credit and attribution scope (Unit of Credit)
While I described DDA engines in Section 3, this pillar concerns the very scope of attribution credit implementation.
Google Ads grants the entire unit of credit (or a portion of it within its own silo) exclusively to paid Google media. If an ad click occurred within the conversion window, Google Ads treats that transaction as its own.
GA4, when broken down across the entire marketing mix, treats a paid Google click as merely one piece of the puzzle. If the user arrived via email and organic search before purchasing, GA4 will reduce the fraction attributed to Google Ads to a marginal value.
The two systems operate in different currencies:
- Google Ads currency: “Did our ad play a role in this?” (If yes = it takes credit).
- GA4 currency: “What was the relative weight of Google Ads compared with the other channels?” (If it played a role = it gets only a fraction of the value).
Pillar 4: Identity stitching and cross-device data (Identity Stitching)
The fourth pillar concerns the technology for recognizing the same user across different devices.
In the case of Google Ads, the situation is different. When a user browses the offer on a phone (while logged into a Google account) and then makes a purchase on a computer, the Google Ads system attempts to connect these two touchpoints. It uses cross-device conversion modeling (Cross-Device) based on anonymous Google Signals and statistics. However, this is not 100% reliable tracking – it depends on cookie consent (Consent Mode) and data volume.
GA4, in turn, relies on a strictly defined identity hierarchy (Reporting Identity). If you do not have a properly implemented user_id in GA4 (based on your own customer login system in the store), the system will treat a smartphone and a laptop as two completely unrelated users. The ad click on the phone will be attributed in GA4 to a new mobile session (which ends without a conversion), while the later purchase on desktop will come in as direct traffic (Direct) or organic. As a result, Google Ads will attribute the conversion to the mobile campaign, while GA4’s default reports will split this path into two independent traces.
Pillar 5: Conversion window asymmetry and view-through conversions (VTC – View-through conversions )
The final, fifth pillar of the architecture consists of the time frames and types of interactions in which the systems allow credit to be assigned to an ad.
- Google Ads: Allows flexible configuration of the click-through conversion window (Click-through conversion window) from 1 to 90 days (the default is 30 days). In addition, Google Ads supports view-through conversions (View-through conversions – VTC) with a window from 1 to 30 days (this mainly applies to GDN banner campaigns, the YouTube video network, and PMax). VTCs are enabled by default for selected action types and assign credit to an ad that the user merely saw, but did not click.
- GA4 operates on attribution windows of 30 to 90 days for purchase-type events, but by definition it does not count standard view-through conversions (VTC) from display/YouTube campaigns (VTCs are available mainly in Display, YouTube, and PMax) – it requires a physical click and visit to the site. In such a scenario, Google Ads will show +1 conversion (VTC), GA4 will show 0 from Google and 1 from Direct – hence the additional discrepancy.
Where does the data split occur in practice?
If a user sees a remarketing banner on YouTube, does not click it, but 2 hours later visits the website from bookmarks and makes a purchase:
- Google Ads will count this as a view-through conversion (View-through conversion).
- GA4 will not see the ad touchpoint at all and will attribute the entire key event to the Direct source.
In Google Ads, view-through conversions can be disabled at the conversion action level, which often reduces the discrepancy with GA4.
Summary of the five pillars in a nutshell
Here is a complete cheat sheet comparing the architecture of both tools:
| Pillar | Google Ads | Google Analytics 4 |
| 1. Dating | Click-date: Date of the ad click (data is updated retroactively). | Event-date: Date of purchase on the website + Processing Lag (24-48h for recalculation). |
| 2. Counting | Configurable per action: One (lead) or Every (e-commerce). | Atomic: Each recorded key event (unless Once per session is set). |
| 3. Scope | Siloed: 100% of credit divided only among Google ads. | Multi-channel: Credit divided among all sources in the mix. |
| 4. Cross-device | Logged-in Google account users (Google Signals / Ad Graph). | Dependent on user_id implementation (by default, based on the device cookie). |
| 5. Types & Windows | 1-90 day window. Counts view-through conversions (VTC) from GDN/YouTube. | 30-90 day window. Counts only click-through interactions (Click-through). |
Consent Mode v2 and privacy asymmetry – How algorithms artificially deepen the gap
While the first five pillars stem from classic database architecture and attribution rules, the implementation of Consent Mode v2 added a completely new element to this equation: advanced mathematical modeling of data loss (Behavioral & Conversion Modeling).
In the world after the introduction of the DMA regulations (Digital Markets Act), neither of these systems operates solely on hard, measured deterministic events anymore. Both try to “patch the holes” left by missing cookie consents using machine learning. The problem is that the modeling engine in Google Ads and the modeling engine in GA4 are two entirely separate algorithms.
How does Google Ads treat a lack of consent, and how does GA4?
When a user enters your website and clicks “Reject all” on the consent banner, the Consent Mode v2 mechanism is activated:
- Tag status: Tags switch into advanced mode (advanced mode). They do not store cookies, sending only so-called pings (anonymous navigation signals).
- Modeling in Google Ads: The advertising engine processes these anonymous signals to estimate the likelihood of a transaction and models a conversion in the Ads dashboard. Google documents a specific entry threshold: for modeling to start, you need at least 700 ad clicks within 7 days, counted per country and domain group, as well as a correctly implemented Consent Mode (or IAB TCF v2.0). Below this volume, Google Ads has nothing to build a model from and simply will not model conversions for the given segment.
- Modeling in GA4: GA4 sets its own entry conditions, but unlike Google Ads, it does not publish a single specific numerical threshold (number of users or days) for enabling behavioral modeling – Google’s documentation describes only the mechanism (cookieless pings feeding the model), not the volume threshold. In practice, this means you cannot calculate in advance when modeling in GA4 will “turn on” in the way you can for Google Ads – which in itself is a source of yet another asymmetry: Ads provides an explicit entry rule, while GA4 operates as a black box.
The asymmetry mechanism in practice
Let’s map this on a timeline for an e-commerce website where 40% of users reject cookies:
| Step | Actual event | Google Ads panel | GA4 panel |
| 1. | 100 users click a PMax ad and reject consent (Consent Denied). | Anonymous pings are sent. | Anonymous pings are sent. |
| 2. | 5 of them make a purchase without tracking consent. | No hard cookie. | No hard cookie. |
| 3. | Work of modeling algorithms | The Ads model estimates the gaps and adds, for example, +4.2 modeled conversions (example value). | GA4, if the threshold is not met, shows 0 key events, while after applying data hiding (Data Thresholding), it removes them from the report or assigns them to unassigned categories. This mainly applies to standard reports – in Explorations (Explorations), privacy thresholds work differently, and low-sample data is either fully visible or excluded at the level of specific dimensions. |
Conclusion: Consent Mode v2 has created a space in which Google Ads sees estimated advertising success based on predictive models for advertisers, while GA4 applies more rigorous protective filters for analytics data.
Decision framework – Which number should you trust, and when?
Now that we know that aligning data between Google Ads and GA4 is technically impossible, it is time to answer the most important business question: which data source should you use in day-to-day work?
In practice, I use a simple decision framework, assigning each panel to the tasks for which it was designed.
When should you trust Google Ads data?
- Controlling Smart Bidding algorithms (Target ROAS / Target CPA): Google’s bidding algorithms need the full picture and signals from the Google Ads DDA model.
- Assessing the effectiveness of creatives, keywords, and PMax assets: When you want to know which headline or asset group attracts attention best, you look in Ads (the Click-date view).
- Scaling budgets within the Google channel: Moving funds from Search campaigns to Performance Max is based on data from Google Ads.
When should you trust GA4 data?
- Allocating budget between different channels (Cross-channel Budgeting): The decision to move budget from Meta Ads to Google Ads or Email marketing requires GA4 data (the Cross-channel perspective).
- Analyzing the full journey and on-site behavior (Customer Journey & CRO): Assessing the conversion rate of landing pages or drop-offs at checkout steps in an Event-date view.
- Assessing the real contribution to total revenue (Finance & Reporting): Reports for the Management Board or finance department summarizing actual revenue in a given calendar month are built on the basis of GA4 (or ERP/CRM), because they are indexed by the actual transaction date.
Quick technical audit: What should you check when the difference exceeds 30%?
If the discrepancy between Google Ads and GA4 is 10-20%, you are within the architectural norm. However, if it exceeds 30%, go through the audit checklist below:
- [ ] Double tag firing: Does the thank-you page (thank-you page) avoid refreshing events, and is the transaction ID unique?
- [ ] Counting rules: Is the action in Google Ads not set to Every while the event in GA4 is counted as Once per session?
- [ ] Consent Mode v2 errors: Is the GA4 tag not being physically blocked before consent while Google Ads receives anonymous pings?
- [ ] View-through conversions (VTC): Are you not analyzing a Google Ads report containing a mass of View-through conversions from the video/Display network that GA4 has no right to see?
- [ ] Attribution window configuration: Is the window in Ads not 90 days while in GA4 it is 30 days (or vice versa)?
- [ ] Lack of User ID implementation: Is the lack of user identification causing GA4 to split mobile and desktop paths?
- [ ] Processing Lag: Are you not comparing data from the last 24–48 hours?
FAQ
Frequently Asked Questions
For the vast majority of e-commerce and lead-gen accounts, I recommend using the native Google Ads conversion tag (with Enhanced Conversions implemented) as the primary goal (Primary) for campaigns. They require user data (e.g. email, phone) to be provided in the form and may be subject to additional consent requirements (Consent Mode).
Summary: Two lenses, one reality
Trying to achieve a situation in which Google Ads and GA4 show identical numbers is doomed to fail from the outset. This is not a tracking error, but the result of the different engineering of both tools.
Here are four key conclusions worth remembering:
- A different timeline and a different currency: Google Ads attributes conversions retroactively to the click date (Click-date) and values its own silo. GA4 books key events at the moment of purchase (Event-date), accounts for processing delays (Processing Lag), and divides the same success point across the entire multi-channel path.
- Algorithmic modeling deepens the gap: In the era of Consent Mode v2, Google Ads has a lower threshold for activating predictive models, while GA4 applies more restrictive requirements for the volume of consenting users and privacy filters.
- Separate the roles of both tools: Use Google Ads as the control cockpit for optimizing bids, creatives, and keywords. Treat GA4 as the control tower for allocating budget between different channels and reconciling the overall business.
- Accept the 10–20% range as the norm: Treat a difference within these limits as a correct state. Only when the discrepancy exceeds 25–30% should you run the technical audit checklist.
Once you start reading these two screens as two different lenses aimed at the same customer journey, you will gain full control over the budget and effectiveness of your marketing activities.
Bibliography
Attribution and GA4 vs Google Ads Discrepancies
Data discrepancies — factors and troubleshooting support.google.com/google-ads/answer/7457111
Attribution models in Google Ads: support.google.com/google-ads/answer/6259715
Data-driven attribution in Google Ads: support.google.com/google-ads/answer/6394265
Data-driven attribution / Get started with attribution in GA4: support.google.com/analytics/answer/10596866
Configuring attribution windows in GA4: support.google.com/analytics/answer/10597962
Conversion windows and VTC
Conversion windows in Google Ads — overview: support.google.com/google-ads/answer/3123169
View-through conversion window: support.google.com/google-ads/answer/7320922
View-through conversions (VTC): support.google.com/google-ads/answer/1722022
Consent Mode v2 and modeling
Consent Mode v2 — configuration and modeling: support.google.com/analytics/answer/9976101
Conversion modeling thresholds in Google Ads: support.google.com/google-ads/answer/10548233
Processing lag
Data freshness and SLA in GA4: support.google.com/analytics/answer/12233314
Enhanced Conversions
Enhanced conversions: support.google.com/google-ads/answer/9888656

About the author
Radosław Mentel
Certified Google Partner (Ads & Analytics) with over 17 years of experience. For years, I've taught marketing at SGH and judged the best campaigns in Poland as a semKRK Awards judge.
More about me