Bounce rate vs. exit rate.

Table of contentsExpand
Google Analytics – Metrics
Today’s post will give you a closer look at two important metrics in Google Analytics. Many users know what the bounce rate is and that its value is important for their online business. However, they do not know how and on what basis its value is calculated. The situation is similar with the exit rate. I will point out the differences between these two metrics and also present several ways to minimize these values. I will describe when a high bounce rate is a serious warning sign and when you should not pay too much attention to it. I hope that, thanks to this post, the topic will become clear to you. Enjoy the read.
Many people spend a great deal of time analyzing the bounce rate, while overlooking a very important metric: the exit rate.
These two metrics are often misinterpreted, and it even happens that some people do not see any difference between them. Using these two metrics interchangeably leads to incorrect conclusions and actions.
So what are the differences between the bounce rate and the exit rate?
Differences between the bounce rate and the exit rate
Let’s start with the definitions:
- Bounce rate: the percentage of sessions on a website in which only one page was opened (the lower, the better). It is worth measuring it globally for the entire website as well as for the most frequently visited landing pages.
- Exit rate: shows how many visitors left our website and on which page they ended their browsing. If we have a high exit rate on the thank you page, that’s great!
Google’s definition is quite misleading, which is probably where the problem with properly understanding these two indicators comes from. After all, the basic purpose of these indicators is to show at what point the user left our website.
Below is a screenshot from Google Analytics with the two metrics highlighted.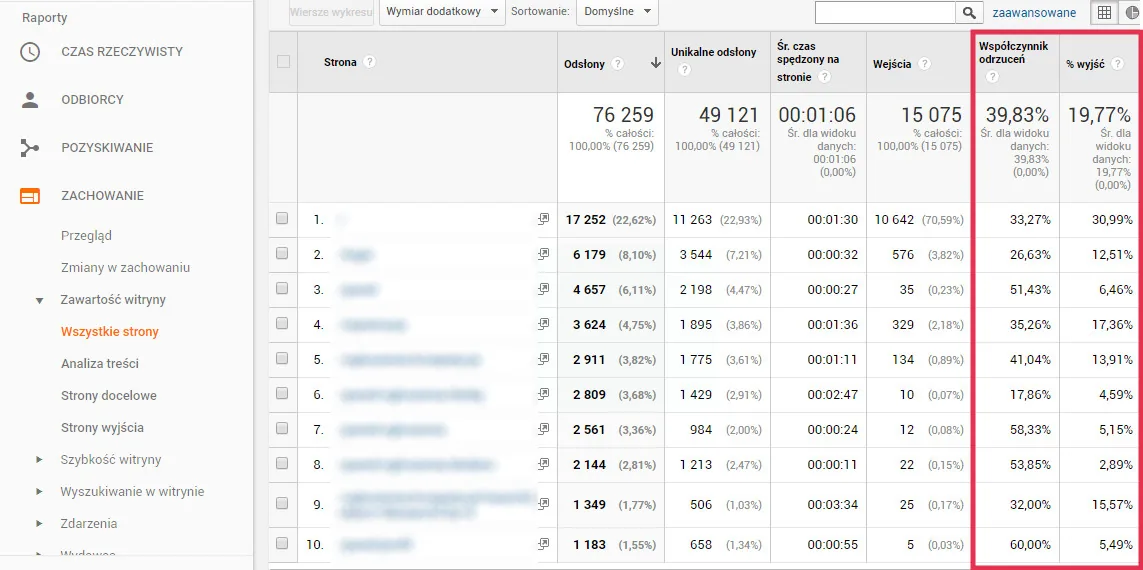
Bounce rate
Exit rate
Now perhaps in more plain language. Thanks to the exit rate in Google Analytics, we can see the percentage of users who left our website after viewing more than one page. The bounce rate, on the other hand, is an indicator that shows us that the user entered and left from the very same page of the website. They did not take any additional interaction.
How to better understand both indicators
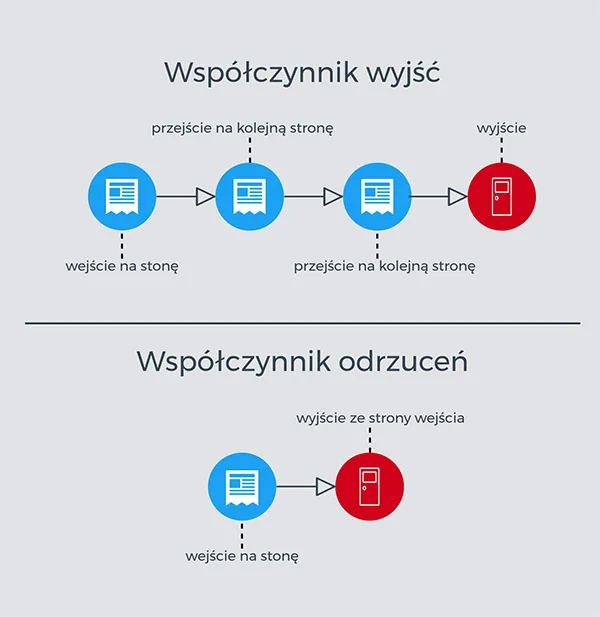
Differences between the bounce rate and the exit rate.
Let’s consider a simple website with several subpages:
- Homepage
- Product page
- Order summary
- Contact us.
Let’s imagine 5 different sessions on this website
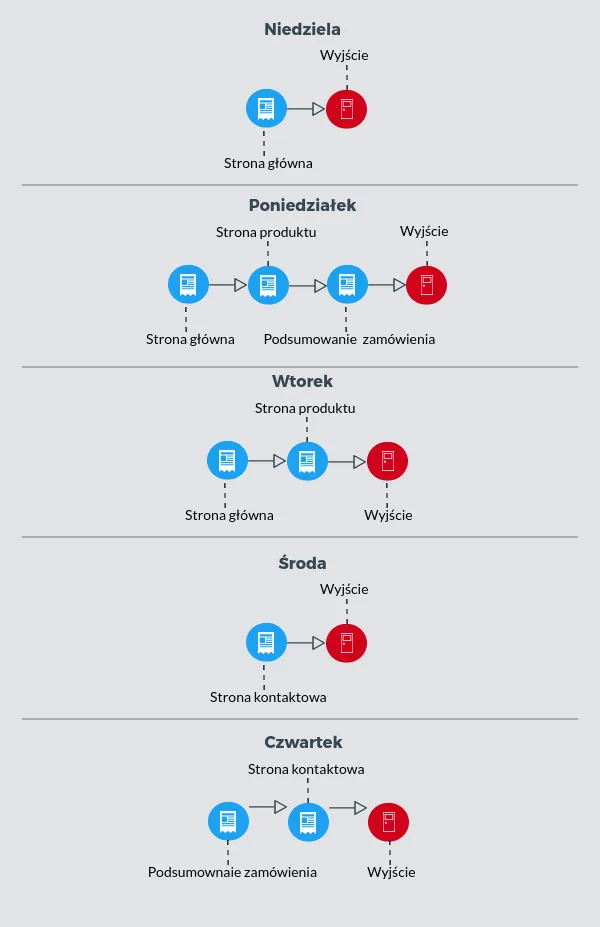 Of the five sessions above, we can classify two that were assigned to the bounce rate in Google Analytics: the Sunday and Wednesday sessions. It was during these two visits that the user left the website on the entry page. On the remaining days, the user visited at least two pages before leaving the website.
In these five sessions, Google Analytics will generate the following report.Homepage:
- 3 entries
- 3 pageviews
- 33% bounce rate
- 33% exit rate
Product page:
- 0 direct entries
- 2 pageviews
- 0% bounce rate
- 50% exit rate
Order summary:
- 1 entry
- 2 pageviews
- 0% bounce rate
- 50% exit rate
Contact page:
- 1 entry
- 2 pageviews
- 100% bounce rate
- 100% exit rate
As you can see from the values of the indicators above, there is no correlation between them. A high exit rate is not necessarily equal to a high bounce rate. This is because users can enter different pages on the website directly; they do not have to reach them through the homepage. They may enter directly, from an ad, or from organic results.
Similarly, a low bounce rate does not mean a low exit rate, because the bounce rate does not include most exits; it includes only those that occur on the first page users enter.
Which of these indicators is more important?
The answer is surprisingly simple and short: BOTH
Above all, you need to learn how to interpret them correctly.
Let’s assume you run a blog and send out a newsletter, and you also promote posts on Facebook. Most readers will open your latest post and end their visit to the website there while waiting for the next article. In this case, high bounce rate values are nothing to worry about. A better solution in such a case would be to segment the data and measure the bounce rate for new visitors. If new visitors have read only one article, this should be a cause for concern.
A high bounce rate may also apply to one-page websites that have no subpages, which gives the user no opportunity to go anywhere else. For this type of website, you need to modify the tracking code so that the bounce rate is calculated as the percentage of users who stayed on the page for, for example, less than 10 seconds. Simply add the following line of code on the given page under the pageTracker.trackPageview(); option:
<script type=”text/javascript”>
setTimeout(function(){ ga(’send’,’event’,’Adjusted bounce rate’,’Page visit 10 seconds or more’); },10000);
</script>
When, on the other hand, do we need to pay more attention to the exit rate?
When we build a specific path for the user, for example, from the product page to the cart, from the cart page to the order summary, and then to payment. When a visitor follows this path, we can call it a success.
A high exit rate from any step in this path means “bad exits.” That is why you need to efficiently identify that point and improve it in order to minimize users “leaking” out of the purchasing process. You can also visualize this path by setting up goals in Google Analytics.
How to reduce the exit rate and bounce rate.
If a website has a high exit rate and your intention is for users to move according to the planned path (through the conversion funnel), e.g. to move them to another part of the website, you can make certain improvements.
First, you need to determine why people are leaving your website. A few common problems include:
- Content distractions: music, ads, videos, and pop-ups can cause early exits
- Loading time: users (especially those on mobile internet) will give up after about 3 seconds
- Lack of responsiveness: a website not adapted to mobile devices
- Poor UI / UX: a badly designed page and complicated structure will discourage users from using the website
- Navigation issues: unclear paths
- Broken links: 404 pages, for example when we have removed a product
- Poorly designed CTA (call to action) buttons
- Links to external websites: we allow the user to leave the website ourselves
Second, you need to give your users a reason to stay.
This does not mean creating a nicer website and a clearer menu. Instead, it is worth rethinking and checking the conversion paths.
It has become accepted that e-commerce websites have a high exit rate and that a conversion rate of around 2% is acceptable, but does it have to be that way? Of course not. If you care about your business, you will always find something to improve; for example, you can configure related products or show users information that people who bought this product also bought another one, and offer them a 5% discount when making a similar choice. I encourage you to test.
Summary
Both indicators are important; you just need to use them skillfully. You cannot forget about segmentation, e.g. by traffic source. You need to test a lot by directing ads to the product page or category page, and carefully examine the purchase path to find “unwanted exits.”
The pages where users’ interaction with your website ends are ideal for optimization. So get to work. You can start the analysis today. Just remember to look at these metrics not only globally for the entire website, but also to analyze each subpage separately. Do you have a problem?
Do you need an audit of your campaign, website, online store, or analytics tool configuration?
Contact me today! Write to hello@radekmentel.pl
Stay up to date! Sign up for the newsletter.