
Avinash Kaushik describes bounce rate as follows; according to him, these are users who came, puked and left.
Table of contentsExpand
I would add that you have just brought in a user to whom you have little to offer, and they slap you in the face!
However, there are exceptional situations, websites, and subpages that you will learn about in this post.
What Do You Know About Bounce Rate?
When talking to people who run online businesses, we always reach a point where I ask about the bounce rate of their websites or online stores.
At first, they look surprised and concerned about why I am asking them some question about some metric from Google Analytics, which they have not looked at since installing the code. I do not ask about the average cart value, returning users, conversion cost, or conversion rate, but about some bounce rate.
If I asked you for the value of your bounce rate, would you answer me immediately? Do you know the value of this metric for your business, and do you know how to interpret its value?
If not, this text will finally help you understand what bounce rate really is and how to analyze it. Thanks to it, you will understand how important this metric is for your business.
If, on the other hand, you are a digital marketing specialist, run an SEO agency, or create UX / UI audits, you will need to be able to explain to your clients what bounce rate is and why you take this particular metric into account when thinking about the user and designing a website.
Unfortunately, bounce rate is not straightforward, which can make it difficult to understand. Its interpretation also requires knowledge, while mistakes in interpreting bounce rate lead to incorrect conclusions and misguided actions.
If you land on a product or service page, read the description, specifications, and price, watch a video guide, sign up for the newsletter, and close the page satisfied with the content, should the bounce rate for such a visit definitely be 100%?
If you do not track events, this is exactly the kind of information about your website you may find in Google Analytics. If you change the page layout, content, and photos to reduce the bounce rate, it will not change anything.
Today’s post aims to explain everything related to bounce rate and the ways of interpreting it. I will also suggest how to correctly measure user engagement on your website. Let’s get started!
What Is Bounce Rate in Google Analytics?
Bounce rate is a key indicator that can tell you a lot about your users’ behavior on your website. Google Analytics defines bounce rate as the percentage of sessions on a website in which the user visited only one page. Bounce rate is taken into account by Google when it comes to your website’s ranking in search results. That is why it is worth paying attention to it.So let’s look at the situations in which a bounce will occur. When a user performs one of the following actions:
- clicks the back button in the browser
- closes the browser tab
- enters a new phrase or URL in the browser’s URL bar
- clicks an external link on the website
- remains inactive and the session times out
This behavior applies to all pages on your website, not only the homepage, but also a blog post, product page, or contact page. You must remember that every page within your website can be the first and the last and may have a different bounce rate!
How Is Bounce Rate Calculated?
To calculate bounce rate, Google divides the number of single-page visits by the total number of pageviews for a given page.
For example: (number of bounces 1943 / number of pageviews 2680)*100%=72.5%
Bounce Rate
Where Can I Find Bounce Rate Data in Google Analytics?
After logging in to your Google Analytics account, in the Audience ➠ Overview tab, you can see the bounce rate for the entire website. Do not pay too much attention to it, unless your website is a one-page site or a blog. From the menu on the left, select Behavior ➠ Site Content ➠ All Pages.
Now you can check which page has the highest bounce rate and which has the lowest. Remember that this is the page on which the visitor starts their visit to your website and on which they end it. 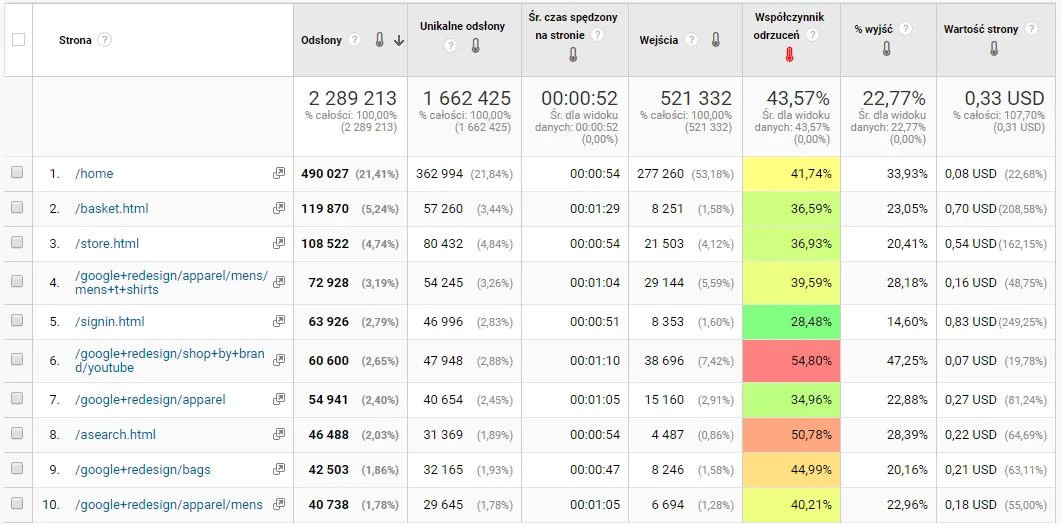 Sort such pages by the highest bounce rate and analyze their content; perhaps they are missing a call-to-action button, perhaps they take too long to load on mobile devices, or perhaps they are difficult to read. Review them and try to diagnose the problem. If it is a contact page, then a high bounce rate for this page is normal. The user entered, completed their goal – sent a message or found a phone number – and closed the page.
Comparison Chart in Google Analytics
Thanks to this chart, we can compare deviations in bounce rate from our website average. You can enable this chart in many views. For example:
- All Traffic ➠ Source / Medium
- Audience ➠ Technology and System ➠ Browser and System
- Audience ➠ Mobile Traffic ➠ Devices
The comparison chart will allow you to quickly diagnose a problem with a page; perhaps there is a loading speed issue in a specific browser. Perhaps it is displayed incorrectly on a specific phone model and browser. Perhaps the campaign we are running has an exceptionally high bounce rate. You need to play detective – I have just put powerful tools in your hands.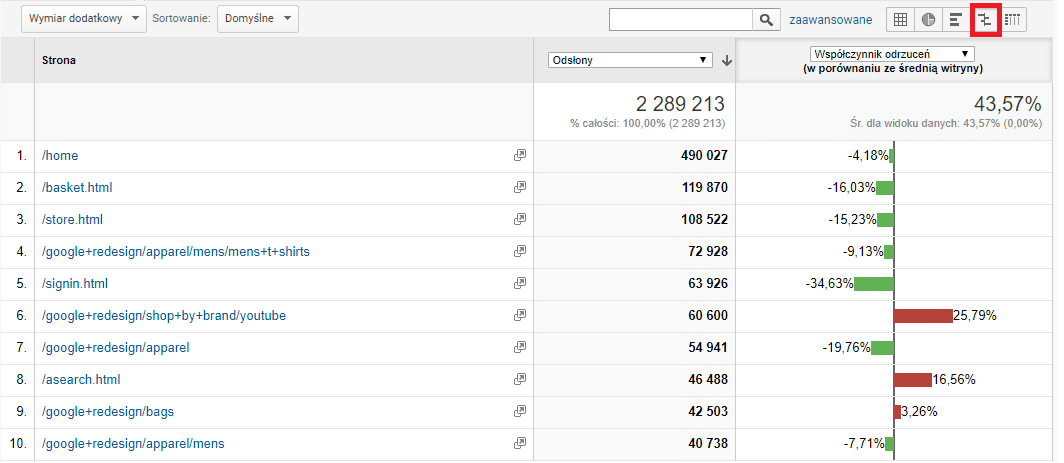
Interpreting Bounce Rate
More important than knowing the definition is the ability to evaluate and learn how to interpret the information collected.
To interpret the results correctly, you need to take the following aspects into account:
- User intent / behavior
- Type of website
- Website quality
- Traffic quality
- Type of marketing channel
- Type of device
I very often encounter bounce rate being confused with exit rate.
Bounce Rate by Traffic Source
Knowing the overall average bounce rate for the website is not enough. If you want to analyze the return on investment (ROI) from advertising campaigns or understand the quality of the traffic generated, you need to take bounce rate into account broken down by individual channels.
In Google Analytics in the Acquisition / All Traffic ➠ Channels tab, you will see where your users are coming from. This is where you will see the main channels such as:
- Organic Search – free traffic from search results from search engines such as Google, Bing, and Yahoo.
- Display – traffic from display ads, e.g. Google Display Network – Google Ads
- Paid Search – traffic from search engine results that is the result of paid advertising through Google Ads or another paid search platform
- Direct – represents all visitors who entered pages on your website either by typing the relevant URLs directly into the browser or by using lists of favorite pages – more below.
- Other – if traffic does not match another channel, it will appear right here
- Referral – traffic that you gain because a user finds you on another website on the internet, e.g. on another blog, online forum, portal, etc.
- Social – traffic from a social network, such as Facebook, LinkedIn, Twitter, or Instagram
- E-mail: visits from users clicking links in email messages
Knowing the differences in bounce rate between individual channels can help you discover a problem and serve as a clue as to what you should focus on and what needs to be improved.For example, you may find an answer there to the question of whether you should improve the website in terms of usability or whether you need to focus on improving communication in the advertising campaign.
What Does Bounce Rate Look Like by Channel?
You may notice that the Social and Display channels have the highest bounce rates. Banner ads do not always appear at the moment when a product or service is being searched for.
They generate many clicks from people who are not interested, hence such a high bounce rate.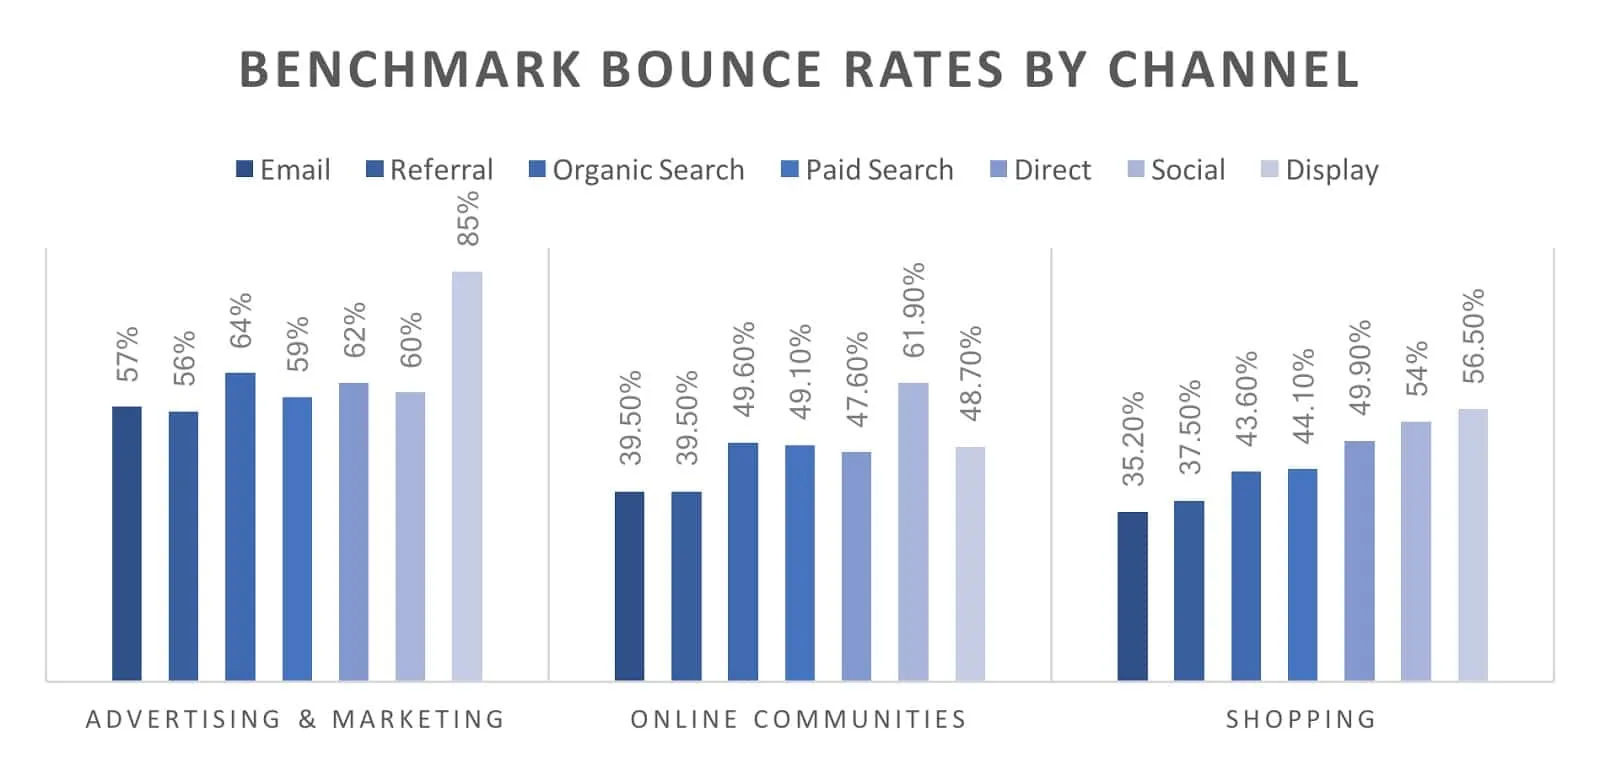
Bounce Rate and Marketing Campaigns
When analyzing bounce rate, you need to focus on traffic quality and bounces from the campaigns you have run or are running. Some campaigns may generate low-quality traffic with a high bounce rate. This is a clear signal that you need to look at these campaigns and modify them – it is possible that the message is not consistent with the offer and the visitor expects to reach a page with different content after clicking the ad.
When observing bounce rate across many accounts, you can notice a pattern: traffic from organic results has a lower bounce rate compared to traffic from social networks or display ads. As I mentioned earlier, this happens because a user from organic traffic wants to reach specific information and actively searches for it, while social media ads or banner ads in the GDN are served by us without their explicit intent.
When reviewing the report, you need to take into account not only the traffic source, but also the landing page and its content, as well as the message through which you attracted the visitor.
Which campaign would you analyze first from the example below?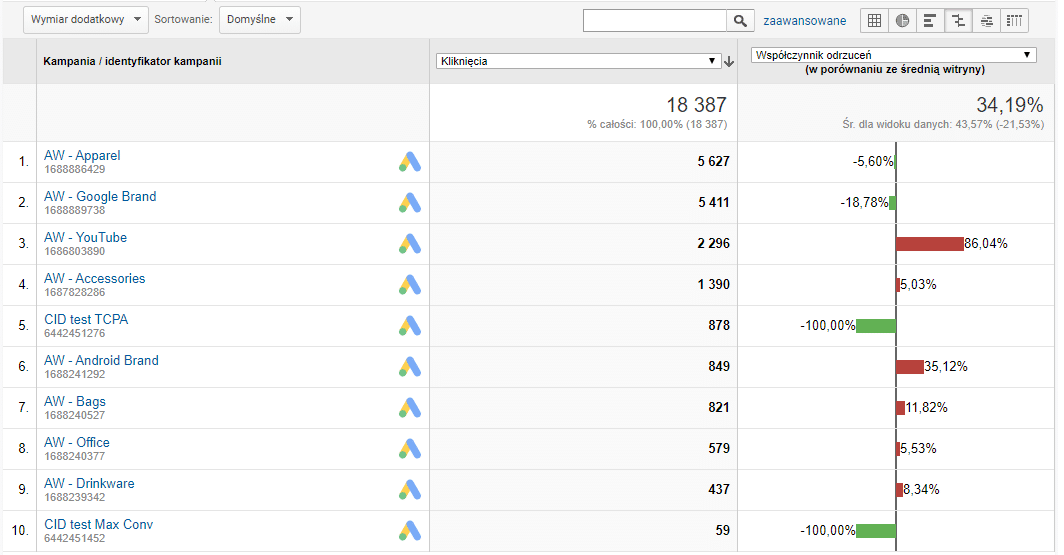
Bounce Rate and Device
Remember that traffic from different sources must be analyzed on several levels, from the general to the specific. If you find pages that have the highest bounce rate in the Behavior➠ Site Content➠ All Pages view, add Device Category as a secondary dimension. The type of device can play a major role in bounce rate statistics. If the page is not optimized for mobile devices and takes a long time to load, the bounce rate is likely to be high.
Bounce Rate by Page Type
Blog
Remember that different types of websites have different goals, and therefore different bounce rates. People visiting blogs often leave the site after reading one post, which is why blogs have a high bounce rate; this is natural and, in principle, nothing to worry about.
The only thing I would pay attention to is that I would segment users into new and returning users and check whether the bounce rate for new users is lower than for returning users. If it is not, it is worth analyzing why – because it should be lower.
One-Page Website
If we do not give the user the option to go to another page and we do not measure engagement, such a page will have a bounce rate of 100%, strange but true. This does not mean that such a page performs poorly; it may perform very well.
Contact Page
It can definitely distort the average for the entire website when it comes to bounce rate. You must remember that a person who lands on such a page goes there for a phone number or wants to use the contact form and end the visit on that page.
Bounce Rate by Industry
There are many factors that determine in which industry and why bounce rate varies. This is a topic for a very long post, and I will not elaborate on it here. I found an interesting chart that shows how bounce rate looked in 2018 across different industries. Pages with 500-999 sessions per day were taken into account. Source.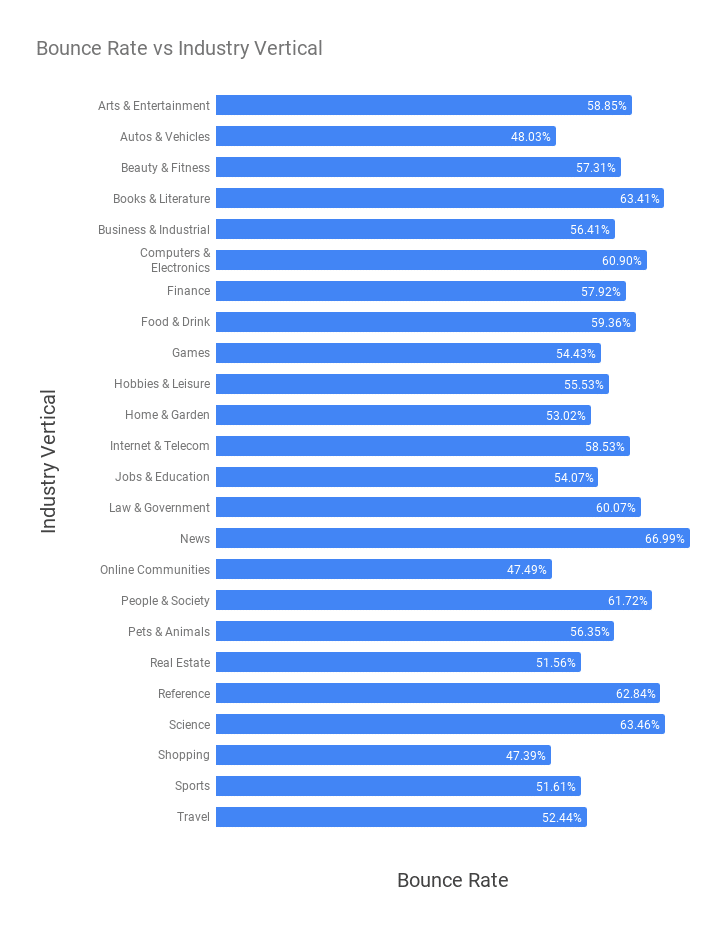
What Is a Good Bounce Rate in Google Analytics?
I often encounter the question of what a “good” bounce rate actually is. Some time ago, I tried to find the answer to this question by analyzing several dozen of my clients’ websites to which I have access. I looked for reports with a much larger sample and found the answer – IT DEPENDS. I know this is not a satisfying answer.
As a rule, bounce rate in the following ranges:
- 26 – 40% is excellent.
- 41 – 55% is roughly average
- 56 to 70% is higher than average, but may not be a cause for alarm depending on the website.
- Higher than 70% disappoints everyone except blog owners, news portals, event websites, etc.
A bounce rate below 20% or above 90% is usually a bad sign. The first indicates a problem with analytics configuration, the second a problem with the website.
How to Reduce Bounce Rate in Google Analytics?
It all depends on the results of the analysis, so not all of these points will apply to your website, but I think this is a good starting point.
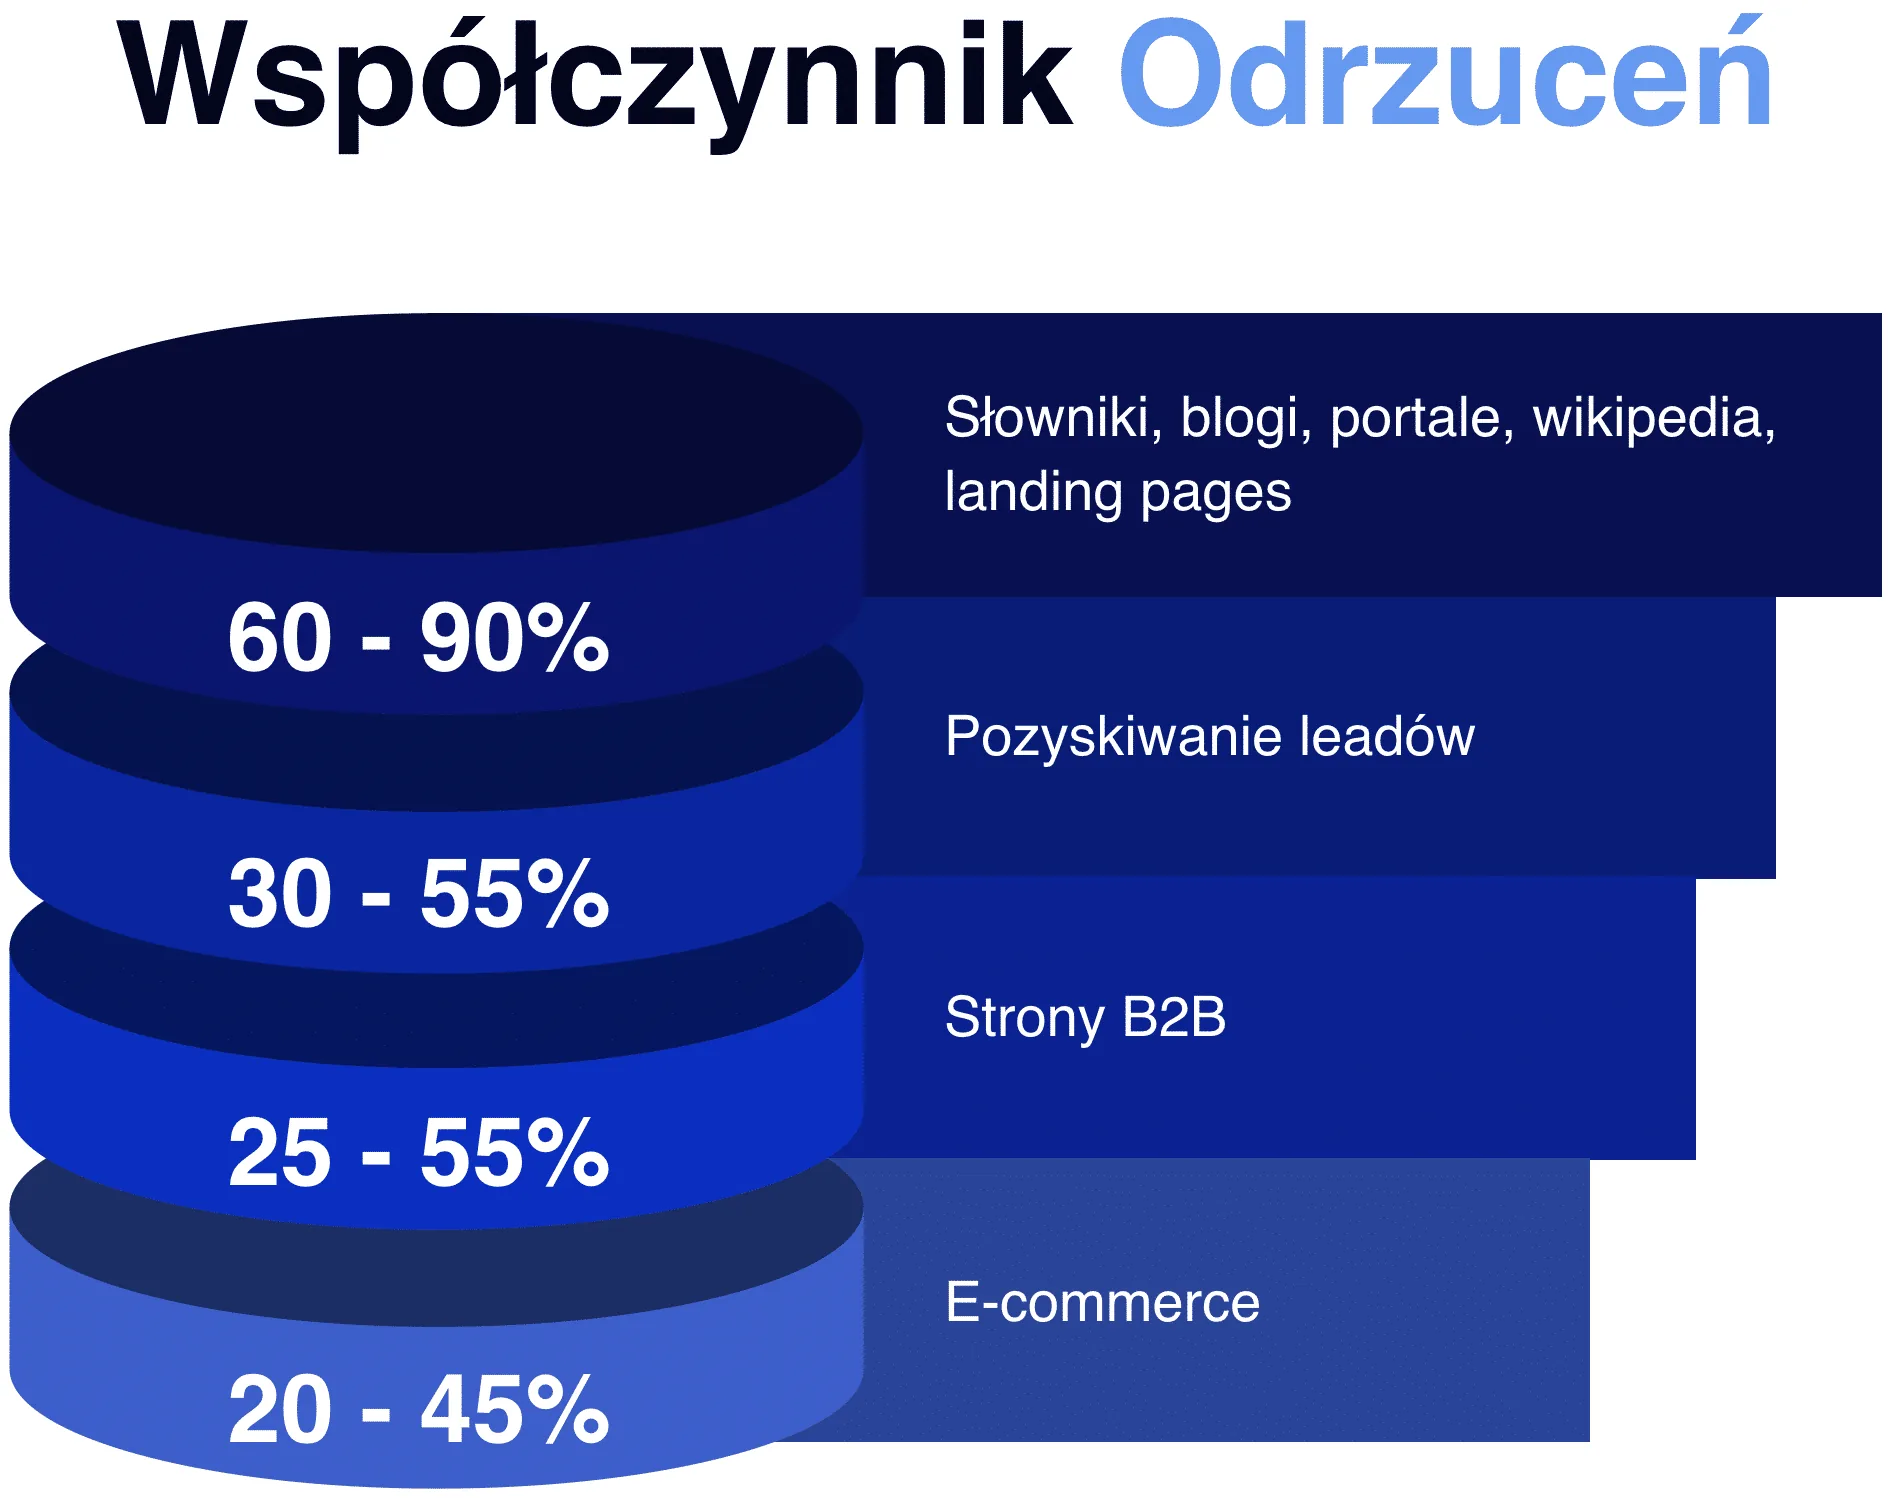
First, set realistic expectations by taking into account the average values for websites similar to yours. As a reminder:
- 20-45% e-commerce
- 25-55% B2B websites
- 30-55% lead generation websites
- 60-90% blogs, dictionaries, news portals
Now, here are the actions that should help you reduce bounce rate, starting with those I consider the most important:
- Website speed – both on desktop and mobile devices; you can find many reports according to which this is one of the key parameters. Test your website using https://gtmetrix.com/ or Google PageSpeed.
- Improve the design and user experience – do not make users think – let them move around your website smoothly and naturally. Remember to include internal links in the content on your pages.
- Check whether your website displays correctly in the most popular browsers and on mobile devices
- Create outstanding content that will not only keep the user on the site longer, but also encourage them to return,
- Design a clear CTA call to action
- Make sure that the content on your pages is consistent with the communication you create in advertising campaigns.
- Focus on using advertising channels with a low bounce rate
- Analyze pages that have a high bounce rate.
What Is the Best Way to Measure Bounce Rate Correctly?
If you use Google Tag Manager, you will be able to do this quickly and efficiently.
Simo Ahava prepared a manual on how to do it once and do it properly.
I therefore refer you to the manual, which you can find here https://www.simoahava.com/analytics/fire-tag-upon-scroll-depth-and-time-spent/If you have problems with the configuration, let me know in the comment, and I will prepare a video tutorial. Thanks to it, you will go step by step through the path of correct configuration and, above all, measuring bounce rate and user engagement.
Summary
I hope I have made you aware of why bounce rate is such an important metric. It is not simply low or high.
Remember to always analyze it in a specific context and move from the general to the specific; Google Analytics will not show you what the problem is. However, it will precisely indicate the place where that problem occurs.
By implementing the solution prepared by Simo Ahava through Google Tag Manager, you will also be able to analyze user engagement.Do you have a problem?
Do you need an audit of a campaign, website, online store, or analytics tool configuration?
Contact me today! Write to hello@radekmentel.pl

About the author
Radosław Mentel
Certified Google Partner (Ads & Analytics) with over 17 years of experience. For years, I've taught marketing at SGH and judged the best campaigns in Poland as a semKRK Awards judge.
More about me